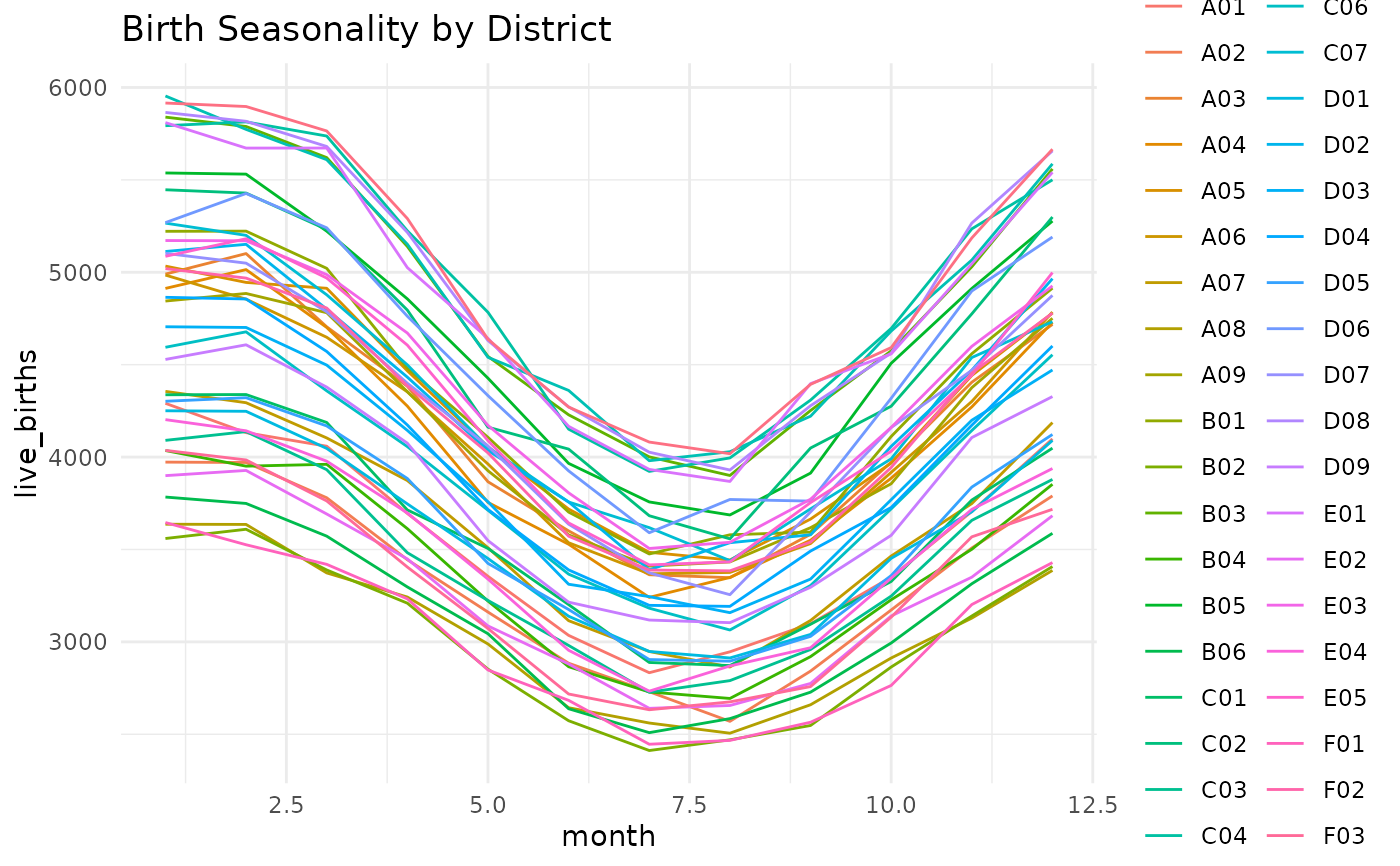
A data frame containing dummy data for live births distribution across the 12 months of a single year for fakeland administrative units.
Format
A data frame with 480 rows and 4 columns:
- prov_code, dist_code
[character]As defined in dummy_monthly_ri_data.- month
[integer]As defined in dummy_monthly_ri_data.- live_births
[numeric]As defined in dummy_monthly_ri_data.
Details
Seasonality Patterns
The live_births column can represent either:
Counts: Actual monthly birth numbers
Proportions: Relative birth distribution per administrative unit
Important notes
This dataset is not required, but if provided, it should contain 12 rows per administrative unit
(one for each month). It is used to adjust the shifting in shift_doses() for better seasonality
representation when monthly routine immunization data is not available.
Values must be non-negative, each administrative unit must have all months 1 through 12,
and the values for each administrative unit must have a positive total. Counts and
proportions are treated equivalently because compute_shift_prop() normalizes them within
each administrative unit.
Examples
# \donttest{
# View the data
head(dummy_birth_seasonality)
#> prov_code dist_code month live_births
#> 1 PR_A A01 1 4291.000
#> 2 PR_A A01 2 4132.273
#> 3 PR_A A01 3 4058.818
#> 4 PR_A A01 4 3695.000
#> 5 PR_A A01 5 3354.818
#> 6 PR_A A01 6 3035.182
# Validate the data
## Set admin to tell the package to expect the corresponding admin unit columns in
## the data for validation
with_config(list(admin = c('prov_code', 'dist_code')), {
validate_birth_seasonality(dummy_birth_seasonality)
})
# Plot seasonality pattern
dummy_birth_seasonality |>
ggplot2::ggplot(
ggplot2::aes(x = month, y = live_births, color = dist_code, group = dist_code)
) +
ggplot2::geom_line() +
ggplot2::labs(title = "Birth Seasonality by District") +
ggplot2::theme_minimal()
 # }
# }