1 Introduction
This vignette lists and explains the data inputs required to run the pviem package. It describes required formats and columns, common pitfalls, and the package helper functions for validating and preprocessing each input.
Read the vignettes in this order: vignette("setup") for configuration, vignette("data") for input requirements, vignette("pviem") for a minimal example, and vignette("workflow") for the detailed end-to-end workflow.
Each dataset section describes the required columns, a packaged example, and the corresponding validate_*() and, where applicable, preprocess_*() helpers.
2 Summary of required datasets
The core inputs are:
- a vaccination schedule;
- vaccine efficacy estimates; and
- routine immunization data containing live-birth counts.
Two additional inputs are conditional:
- birth seasonality can improve dose shifting when RI data are yearly; and
- administrative boundary data are used to create the neighbourhood structure required when extra doses are redistributed with
hed_assumption = "redistribute".
The package provides synthetic examples and validation functions to help users prepare each input. For example, see ?dummy_vs_info and ?validate_vs_info for the vaccination schedule.
2.1 General Data Requirements
To ensure consistency and compatibility with the pviem package, please ensure that your datasets meet the following general requirements where applicable: - Setup: Properly set up the package using config_pviem() before running any functions. This step is crucial for defining key parameters and ensuring consistent data handling throughout the workflow. Refer to the function documentation for detailed setup instructions.
Data format: All datasets should be in a tidy format, where each row represents a single observation and each column represents a variable. Routine immunization and live-birth data must be stored in the same data frame.
Column names and data types: Column names and data types must be consistent with the specifications provided in the corresponding example datasets which are briefly described in this vignette.
-
Missing values: Missing values are only allowed in the following places:
- dose columns in the routine immunization data
- the
fromandtocolumns of the efficacy table
All other datasets should be complete and contain no missing values.
Missing values in RI dose columns will be imputed by the package. Provide these values as
NA, not as zero or another placeholder.Use
NAonly when the value is truly missing. If the correct value is known to be zero, record it as zero rather thanNA. For example, if a vaccine dose has not started being administered in a particular year, it should be recorded as zero. -
Vaccine variants: Vaccine variants naming must follow the pattern
<prefix><vaccine>, where:-
<vaccine>is the core vaccine name (e.g.,OPVorIPVfor polio), -
<prefix>is optional, may contain any non-whitespace characters, and is used to distinguish vaccine variants (e.g.,tOPV,IPV, etc.).
-
-
Dose names: Dose names must follow the pattern
<vaccine><dose_num>, where<vaccine>is the vaccine name (e.g.,OPVorIPVfor polio) and<dose_num>is a one-digit integer indicating the ordinal number of the dose (e.g., 1, 2, 3).- Valid examples:
OPV1,IPV3 - Invalid examples:
OPV01,OPV10
This rule assumes that the number of doses in the vaccination schedule for any vaccine is unlikely to exceed 9, and leading zeros are unnecessary. However if the vaccine name ends with a number (e.g.,
VAX1), thenVAX11is a valid dose name which dose number is 1. - Valid examples:
Dose numbering: Dose numbers must always be one-digit integers.
-
Disease serotypes: Disease serotypes naming must follow the pattern
<disease><serotype_id>, where:-
<disease>is the core disease name (e.g.,PVfor poliovirus), -
<serotype_id>is the identifier to distinguish serotypes (e.g., 1, 2, 3). - Example:
PV1
-
Documentation: Carefully read each dataset’s documentation to ensure proper understanding and usage and format.
Validation: Use the package’s validation functions to ensure your datasets are properly formatted before use.
2.2 Vaccination schedule
The vaccination schedule defines the timing and sequence of vaccines administered to children for a specific disease. The package’s example dataset related to vaccination schedules is dummy_vs_info. Required columns:
-
vaccine: Core vaccine types (e.g., “OPV”, “IPV”) -
dose_num: Ordinal dose number starting from 0 or 1 (e.g., 1, 2, 3); -
age: A number indicating the age at which the dose is administered (e.g., 0, 6, 14); -
age_unit: Age unit. Must be one of “week”, “month”, or “year”.
Use validate_vs_info() to check formatting and preprocess_vs_info() to standardize the dataset for downstream use. See ?dummy_vs_info and ?prep_dummy_vs_info for more details on the format.
Code example:
dummy_vs_info| vaccine | dose_num | age | age_unit |
|---|---|---|---|
| OPV | 0 | 0 | week |
| OPV | 1 | 6 | week |
| IPV | 1 | 6 | week |
| IPV | 2 | 6 | month |
validate_vs_info(dummy_vs_info)
preprocess_vs_info(dummy_vs_info)| vaccine | dose | age |
|---|---|---|
| OPV | OPV0 | 0.0000000 |
| OPV | OPV1 | 0.1153846 |
| IPV | IPV1 | 0.1153846 |
| IPV | IPV2 | 0.5000000 |
2.3 Efficacy estimates
Efficacy estimates represent vaccine protection probabilities. The packaged efficacy_default dataset contains estimates for poliovirus OPV (tOPV and bOPV) and IPV vaccines retrieved from peer-reviewed literature. The exact references and their mapping to individual rows are not yet recorded in the repository; adding them would make the dataset fully traceable. Required columns:
-
serotype: As defined in @sec:data-reqs-general, but multiple numeric serotype identifiers may be combined when the same efficacy applies to each one (e.g.,PV13for poliovirus serotypes 1 and 3). -
vaccine_type: Vaccine variant (e.g., “tOPV”, “bOPV”, “IPV”, etc.) -
dose_num: Ordinal dose number -
efficacy: Numeric in [0, 1] -
type: Either “per-dose” or “n-doses” indicating whether the efficacy estimate is for each dose or for cumulative doses. -
from,to: First and last year in which the vaccine variant was used.NAmeans there is no lower or upper time limit. These columns support historical vaccine changes, such as the withdrawal of tOPV and its replacement by bOPV. Overlapping use of vaccine variants in the same year is not currently supported.
Use validate_efficacy() to validate the dataset and preprocess_efficacy() to standardize the dataset for downstream use. See ?efficacy_default and ?prep_dummy_efficacy for more details on the format.
Code example:
efficacy_default| serotype | type | vaccine_type | dose_num | efficacy | from | to |
|---|---|---|---|---|---|---|
| PV12 | per dose | tOPV | 0 | 0.39 | NA | 2015 |
| PV1 | per dose | bOPV | 0 | 0.63 | 2016 | NA |
| PV1 | n-doses | IPV | 1 | 0.35 | NA | NA |
| PV1 | n-doses | IPV | 2 | 0.60 | NA | NA |
| PV1 | n-doses | IPV | 3 | 0.84 | NA | NA |
| PV1 | n-doses | IPV | 4 | 0.94 | NA | NA |
| PV2 | n-doses | IPV | 1 | 0.41 | NA | NA |
| PV2 | n-doses | IPV | 2 | 0.80 | NA | NA |
| PV2 | n-doses | IPV | 3 | 0.96 | NA | NA |
| PV2 | n-doses | IPV | 4 | 0.99 | NA | NA |
validate_efficacy(efficacy_default, dummy_vs_info)
preprocess_efficacy(efficacy_default, dummy_vs_info)| serotype | vaccine | vaccine_type | dose | efficacy | from | to |
|---|---|---|---|---|---|---|
| PV1 | OPV | tOPV | OPV0 | 0.3900 | NA | 2015 |
| PV1 | OPV | tOPV | OPV1 | 0.6279 | NA | 2015 |
| PV2 | OPV | tOPV | OPV0 | 0.3900 | NA | 2015 |
| PV2 | OPV | tOPV | OPV1 | 0.6279 | NA | 2015 |
| PV1 | OPV | bOPV | OPV0 | 0.6300 | 2016 | NA |
| PV1 | OPV | bOPV | OPV1 | 0.8631 | 2016 | NA |
| PV1 | IPV | IPV | IPV1 | 0.3500 | NA | NA |
| PV1 | IPV | IPV | IPV2 | 0.6000 | NA | NA |
| PV1 | IPV | IPV | IPV3 | 0.8400 | NA | NA |
| PV1 | IPV | IPV | IPV4 | 0.9400 | NA | NA |
| PV2 | IPV | IPV | IPV1 | 0.4100 | NA | NA |
| PV2 | IPV | IPV | IPV2 | 0.8000 | NA | NA |
| PV2 | IPV | IPV | IPV3 | 0.9600 | NA | NA |
| PV2 | IPV | IPV | IPV4 | 0.9900 | NA | NA |
2.4 Administrative boundaries and neighbourhood structure
Provide the country’s administrative boundaries as an sf object. The boundary data must include columns corresponding to the administrative identifiers specified by the admin argument of config_pviem(). Column names do not need to match the RI data—for example, admin2_code in the boundary data can correspond to dist_code in the RI data through the admin_cols argument of get_neighbors().
The package includes an example dataset, fakeland, illustrating the expected structure.
Although the boundary data are not directly used in the core computations, they are required to derive the neighbourhood structure used when redistributing extra doses (see vignette("workflow")).
The neighbourhood structure is defined as a named list:
Each element corresponds to an administrative unit (e.g., a district).
-
Each element contains a list of vectors representing neighbours at increasing levels of adjacency:
- The first vector contains first-order neighbours (directly adjacent units).
- The second vector contains second-order neighbours (neighbours of neighbours), and so on.
Neighbourhood structure example:
│
├── D1
│   ├── Level 1 neighbours (e.g., D2, D3)
│   ├── Level 2 neighbours (e.g., D4, D5)
│   └── Level 3 neighbours (e.g., D6)
├── D2
│   ├── Level 1 neighbours (e.g., D1, D3)
│   └── Level 2 neighbours (e.g., D4, D5)
└── ...
The package provides get_neighbors() to compute this structure from the boundary data. For more details, see ?fakeland and ?get_neighbors.
Code example:
fakeland |>
  ggplot() +
  geom_sf(aes(fill = admin1_code)) +
  theme_minimal()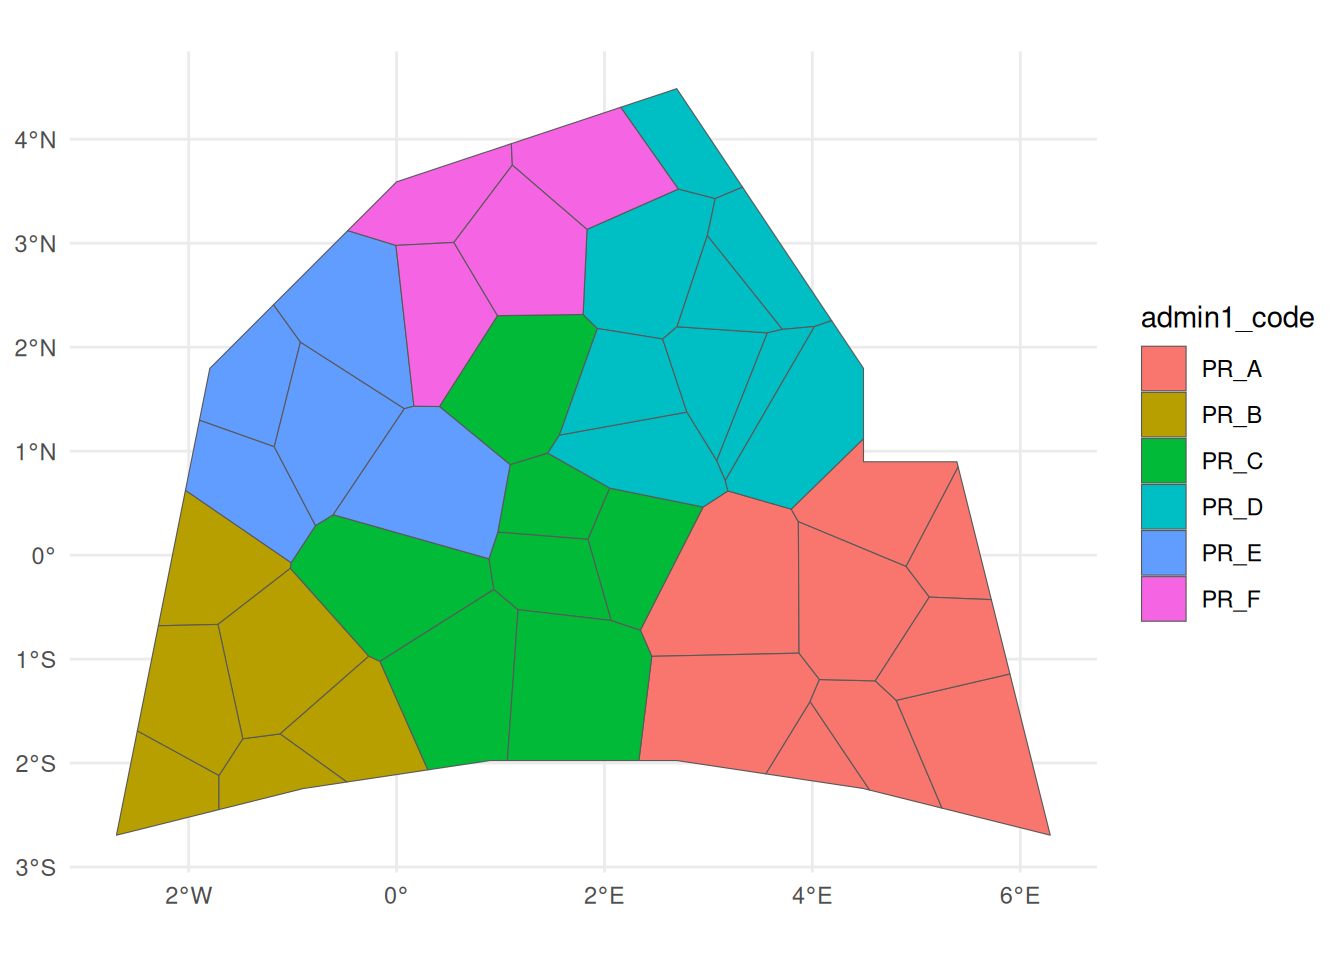
get_neighbors(fakeland, admin_cols = c("admin1_code", "admin2_code"))[[1]]
#> [[1]]
#> [1] "PR_A:::A03" "PR_A:::A06"
#>
#> [[2]]
#> [1] "PR_A:::A02" "PR_A:::A07" "PR_C:::C05" "PR_A:::A08" "PR_A:::A09"
#>
#> [[3]]
#> [1] "PR_A:::A05" "PR_C:::C07" "PR_D:::D01" "PR_D:::D09" "PR_A:::A04"
#> [6] "PR_C:::C02" "PR_C:::C03"
#>
#> [[4]]
#> [1] "PR_C:::C06" "PR_C:::C04" "PR_D:::D04" "PR_D:::D05" "PR_D:::D08"
#> [6] "PR_D:::D06" "PR_B:::B06" "PR_C:::C01" "PR_E:::E05"
#>
#> [[5]]
#>  [1] "PR_D:::D02" "PR_F:::F02" "PR_F:::F03" "PR_D:::D07" "PR_D:::D03"
#>  [6] "PR_B:::B03" "PR_B:::B04" "PR_B:::B01" "PR_E:::E02" "PR_E:::E03"
#> [11] "PR_E:::E04"
#>
#> [[6]]
#> [1] "PR_F:::F04" "PR_F:::F01" "PR_B:::B02" "PR_B:::B05" "PR_E:::E01"
When multiple administrative columns are used (e.g., province and district), the geometry must represent the lowest-level administrative unit. For example, if admin = c("prov_code", "dist_code"), the boundary data should contain district geometries and a province code for each district. get_neighbors() combines the province and district codes using ::: (e.g., P1:::D1).
# Error when admin_cols does not define the same number of columns as admin argument
# of config_pviem()
try(get_neighbors(fakeland, admin_cols = "admin2_code"))
#> Error in get_neighbors(fakeland, admin_cols = "admin2_code") :
#>   'admin_cols' must have the same length as the number of administrative columns defined in 'admin' argument of config_pviem() which is 2; not 1.

# It works when config_pviem() is changed to expect one admin column
with_config(list(admin = "dist_code"), {
  get_neighbors(fakeland, admin_cols = "admin2_code")[[1]]
})
#> [[1]]
#> [1] "A03" "A06"
#>
#> [[2]]
#> [1] "A02" "A07" "C05" "A08" "A09"
#>
#> [[3]]
#> [1] "A05" "C07" "D01" "D09" "A04" "C02" "C03"
#>
#> [[4]]
#> [1] "C06" "C04" "D04" "D05" "D08" "D06" "B06" "C01" "E05"
#>
#> [[5]]
#>  [1] "D02" "F02" "F03" "D07" "D03" "B03" "B04" "B01" "E02" "E03" "E04"
#>
#> [[6]]
#> [1] "F04" "F01" "B02" "B05" "E01"
# NOTE: with_config() is a helper function to temporarily change the setup for testing
# purposes. It works as withr package's with_*() functions.
2.5 Routine immunization and birth data
Routine immunization data and live births data are very important for the immunity estimation. These datasets must be in a single data frame with the following required columns:
-
admin columns: One or more columns that together uniquely identify each administrative unit which names are defined in theadminargument ofconfig_pviem(). -
year column: Year of the record which name is defined in theyearargument ofconfig_pviem(). -
month column: Month of the record which name is defined in themonthargument ofconfig_pviem(). Required when using monthly data (monthly = TRUEinconfig_pviem()). -
birth column: The counts of live births for the administrative unit and time (year and month if applicable). The name of this column is defined in thebirthargument ofconfig_pviem(). -
dose columns: One or more columns representing the number of doses administered for each vaccine dose. The names of these columns must match thedoseidentifiers in the preprocessed vaccination schedule table (see @sec:data-vs).
The package provides two example datasets, dummy_yearly_ri_data and dummy_monthly_ri_data, illustrating the expected structure for yearly and monthly data, respectively.
Use validate_ri_data() to validate the dataset format. See ?dummy_yearly_ri_data, ?dummy_monthly_ri_data, and ?validate_ri_data for more details.
Code example:
head(dummy_yearly_ri_data)| prov_code | dist_code | year | OPV0 | OPV1 | IPV1 | IPV2 | live_births |
|---|---|---|---|---|---|---|---|
| PR_A | A01 | 2010 | 42834 | 37177 | 40987 | NA | 42862 |
| PR_A | A01 | 2011 | 44935 | 38919 | NA | 40944 | 41429 |
| PR_A | A01 | 2012 | 43244 | 44548 | 38286 | NA | 43461 |
| PR_A | A01 | 2013 | 38402 | 36718 | 44257 | 47729 | 43097 |
| PR_A | A01 | 2014 | 41949 | 37485 | 44051 | 47834 | 42742 |
| PR_A | A01 | 2015 | 45877 | 45184 | NA | 35260 | 43190 |
validate_ri_data(dummy_yearly_ri_data, prep_dummy_vs_info)

head(dummy_monthly_ri_data)| prov_code | dist_code | year | month | OPV0 | OPV1 | IPV1 | IPV2 | live_births |
|---|---|---|---|---|---|---|---|---|
| PR_A | A01 | 2010 | 1 | 3881 | NA | 3653 | 3416 | 3932 |
| PR_A | A01 | 2010 | 2 | 2948 | 2532 | 4532 | NA | 4218 |
| PR_A | A01 | 2010 | 3 | 4751 | 3358 | 3359 | NA | 4281 |
| PR_A | A01 | 2010 | 4 | 4573 | 4052 | 3269 | NA | 4083 |
| PR_A | A01 | 2010 | 5 | 2675 | 1713 | NA | 2939 | 3300 |
| PR_A | A01 | 2010 | 6 | 3765 | 2894 | 2778 | NA | 3012 |
with_config(list(monthly = TRUE), {
  validate_ri_data(dummy_monthly_ri_data, prep_dummy_vs_info)
})
2.6 Birth seasonality (optional)
When available, birth seasonality data describe how births are distributed across months within each administrative unit. These data are used to align children receiving a vaccine dose at a given age with their corresponding birth cohort. This is particularly useful with yearly routine immunization data because it reduces misalignment between vaccination timing and the population at risk. Required columns:
admin month and birth columns: As defined in @sec:data-ri-birth.-
birth column: As named in @sec:data-ri-birth, representing the number or proportion of births for each administrative unit and month.- If monthly live birth data are available, values may correspond to average monthly births across years or a linear interpolation.
The package provides an example dataset, dummy_birth_seasonality, illustrating the expected structure.
Use validate_birth_seasonality() to check that the data meets the required format. See ?dummy_birth_seasonality and ?validate_birth_seasonality for more details on the format.
Code example:
head(dummy_birth_seasonality)| prov_code | dist_code | month | live_births |
|---|---|---|---|
| PR_A | A01 | 1 | 4291.000 |
| PR_A | A01 | 2 | 4132.273 |
| PR_A | A01 | 3 | 4058.818 |
| PR_A | A01 | 4 | 3695.000 |
| PR_A | A01 | 5 | 3354.818 |
| PR_A | A01 | 6 | 3035.182 |
validate_birth_seasonality(dummy_birth_seasonality)2.7 Quick validation
All the data required by the package can be quickly validated using validate_all_data() which runs all the individual validation functions and cross-checks. This function expects preprocessed vaccination schedule and efficacy data, so make sure to preprocess them first if you want to use this function.
Code example:
validate_all_data(
  vs_info = prep_dummy_vs_info,
  efficacy = prep_dummy_efficacy,
  ri_data = dummy_yearly_ri_data,
  birth_seasonality = dummy_birth_seasonality
)
For runnable examples and visual checks, see vignette("workflow") which demonstrates how to load, validate and visualise the example datasets.